CASE - 2025 - 2026 Fintech - Dashboard - Web Moscow, RU

Vortex

A dark-mode fintech dashboard for daily operational control: balances, transactions, categories, and performance metrics in a single high-density interface.

Vortex dashboard preview
Client

Vortex FinOps

Services

Product design - Frontend - Backend

Timeline

9 months - 2025 - 2026

Team

7 specialists - 4 engineers

01 - Challenge

Design a dense fintech interface that still feels fast and readable.

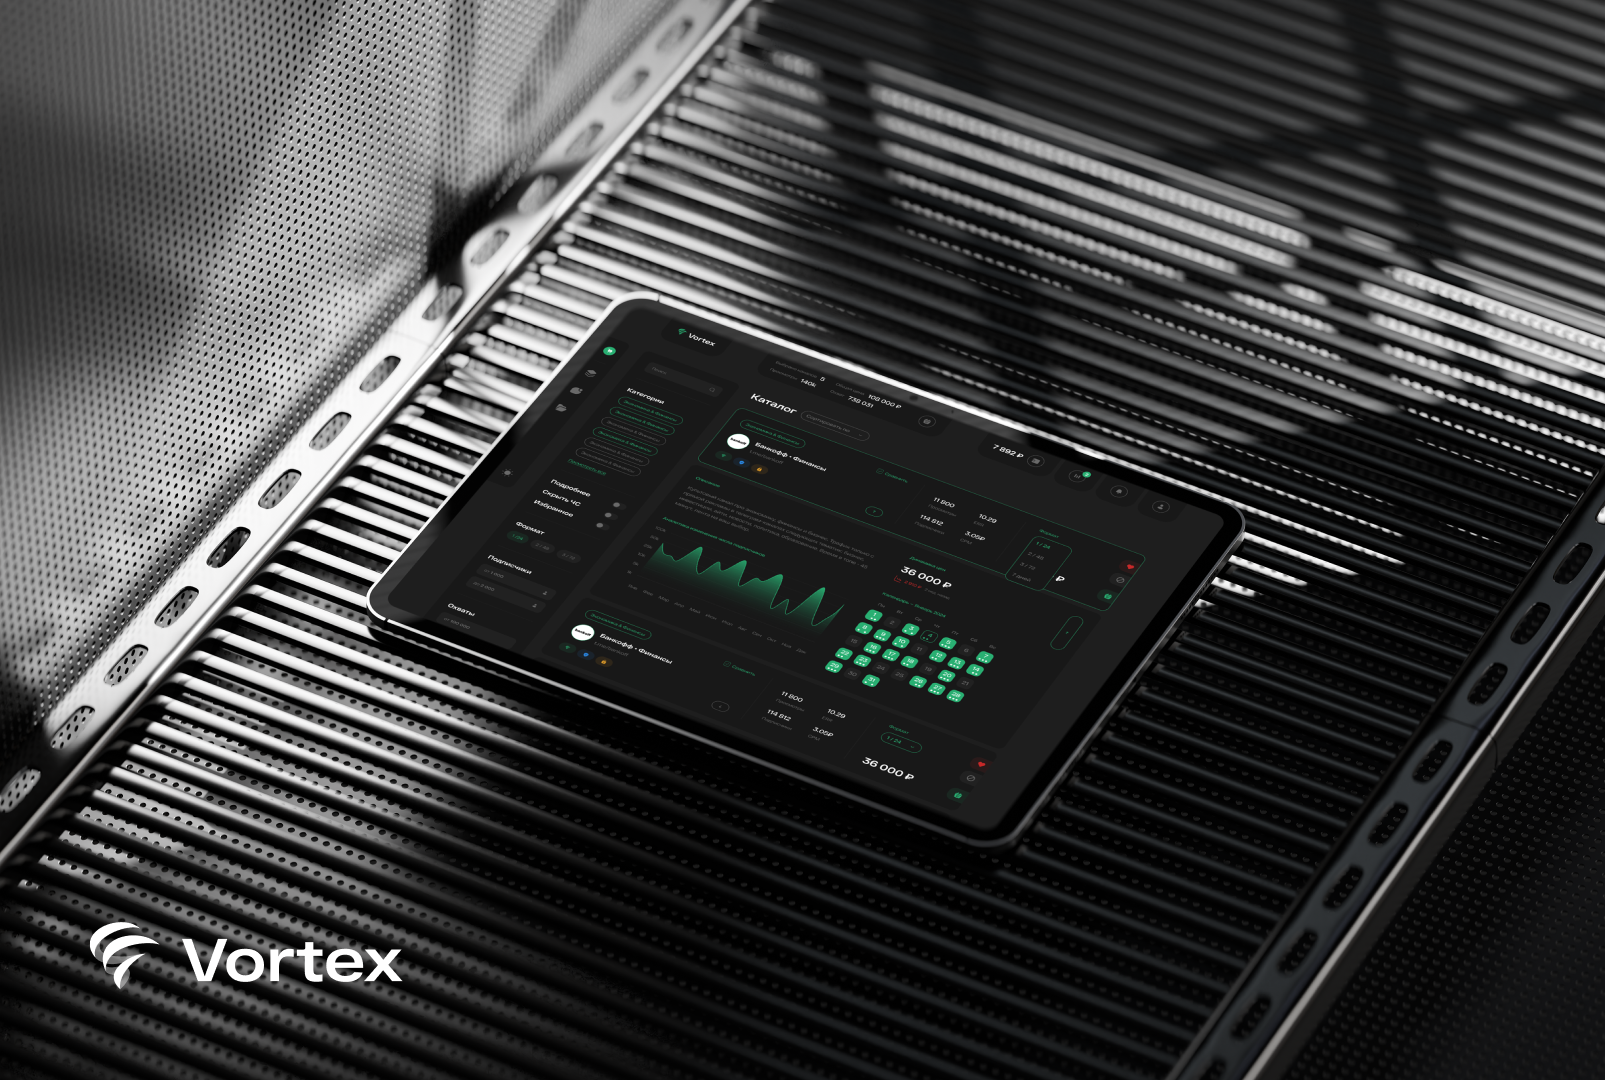
The product had to support heavy daily usage: multi-account views, category-level analytics, balance history, and quick actions - all inside one workspace. Most competing dashboards were overloaded and hard to scan.

The objective was clear: enterprise-level information depth with a consumer-grade interaction speed and visual clarity.

02 - Goals

Delivery targets.

  • Ship an MVP in under 10 months

    Core dashboard, transactions, categories, and wallet management.

  • Cut time-to-insight for financial managers

    Prioritize hierarchy, contrast, and quick drill-down actions.

  • Enable mobile check-ins for leadership

    Responsive views for key metrics and alerts on the go.

  • Keep architecture ready for integrations

    API-first structure for ERP, payment systems, and exports.

03 - Solution

A high-contrast UI system built for speed.

We built the interface around functional contrast: dark neutral surfaces, precise green highlights for positive states, and strict spacing rules for fast scanning. Cards and widgets are modular, so teams can adapt screen composition without redesigning the whole product.

The backend aggregates transactions and category metrics into compact API responses, keeping the dashboard responsive even with large datasets and frequent refreshes.

04 - Process

Structured delivery in five phases.

  • Research and architecture planning

    Data model, user roles, and dashboard priorities.

  • Design system and key flows

    Widget library, table behaviors, and state handling.

  • Core development

    Transactions, categories, charts, and wallet modules.

  • QA and performance tuning

    Load checks, edge-case handling, and rendering optimization.

  • Launch and iteration cycle

    Weekly releases with user analytics feedback.

05 - Technology

Stack focused on reliability and extensibility.

LaravelVue 3TypeScriptPostgreSQLRedisDockerREST APIChart.jsGitLab CI
06 - Results

A robust dashboard product ready for scale.

9mo
From discovery to production launch
70+
Dashboard states and widget variants implemented
35%
Faster routine reporting workflows for operations team
99.9%
Observed uptime during initial production period
3
Primary product surfaces: web dashboard, admin panel, mobile views
0
Critical incidents at first milestone after launch
Vortex full case presentation

Building an internal
fintech platform?

We build data-heavy products with clear UX and stable engineering foundations.